Interpreting a network diagram
Network diagrams are visual maps of a network. They show how it is designed and how it operates: the physical and logical devices plus their interconnections. A single network can have multiple diagrams depending on how much detail you want to present.
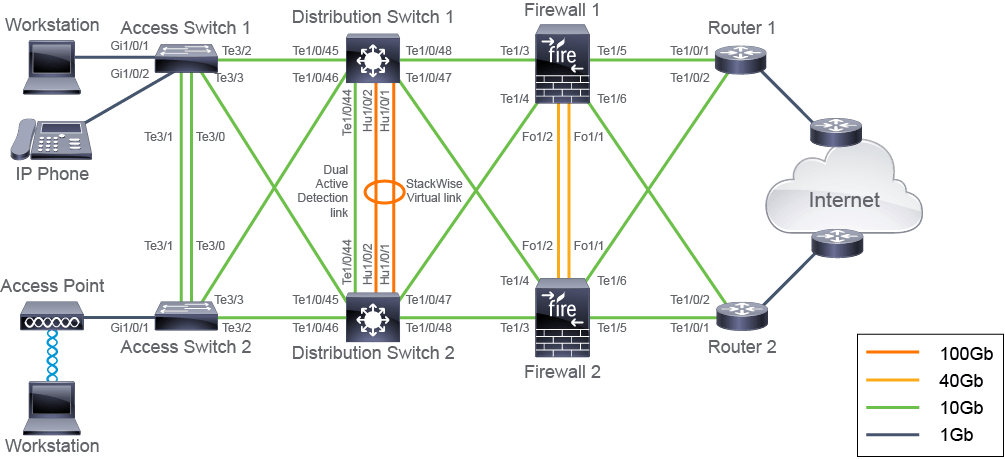
The common diagram types:
- Physical: how interconnections are physically laid out
- Logical: how devices and networks are logically grouped and addressed
- Sequence: chronological exchange of messages between two or more devices
Both physical and logical diagrams use icons for devices and media, usually annotated with device names and models.
Physical vs. logical diagrams
A physical diagram focuses on the physical layout of interconnections. It includes device interface labels (which physical ports the media connects to), location identifiers (where the device physically is), link speeds, and stacking technologies.
A logical diagram focuses on grouping and addressing: encircling symbols (ovals, circles, rectangles) showing how devices or cables are grouped, logical identifiers such as addresses, and configured networking processes such as routing protocols with their basic parameters.
Typical enterprise link speeds seen on physical diagrams: 1 Gbps for endpoint connections (workstations), and 10 / 40 / 100 Gbps for network device interconnectivity. Stacking technologies such as Cisco StackWise (multiple switches linked into a single switching unit) are shown too.
Interface numbering
The numbering convention depends on device type and model:
slot# / port#:Te1/4is port 4 in slot 1.slot# / sub-slot# / port#:Gi1/2/1is port 1 in slot 1, sub-slot 2.
A slot is an opening in a router or switch for installing a module that adds functionality, and a sub-slot is one of the smaller slots some modules contain. Fixed-port switches often have no modular slots; all ports are assigned to the built-in default slot, slot 0.
Cisco port speed abbreviations
- Ethernet:
E, as inE0/0 - FastEthernet:
Fa, as inFa0/1 - GigabitEthernet:
Gi, as inGi1/0/1 - TenGigabitEthernet:
Te, as inTe1/5 - FortyGigabitEthernet:
Fo, as inFo1/0/1 - HundredGigabitEthernet:
Hu, as inHu1/0/2
Note: In some cases the first interface in a slot or sub-slot is numbered 0 instead of 1.