Hands on with Citrix Director and Web Studio
Contents
This is Citrix’s official Director monitoring lab, run start to finish in one morning. I broke logons into their phases, chased a critical memory alert on a server whose load index still read 2%, sent messages into live sessions, ended an application from the console, disconnected and bulk logged off users, reset a roaming profile and checked the result on the file share, read the HDX channels on an idle session, shadowed a published app over Remote Assistance, drove the site to Max Load on purpose, edited a built-in alert threshold until a deliberately slow logon tripped it, and built a custom memory alert from scratch.
The tools for the morning: Citrix Director and Web Studio in the browser, Hyper-V Manager and Remote Desktop Connection Manager on the lab host, and PowerShell on the Delivery Controller.
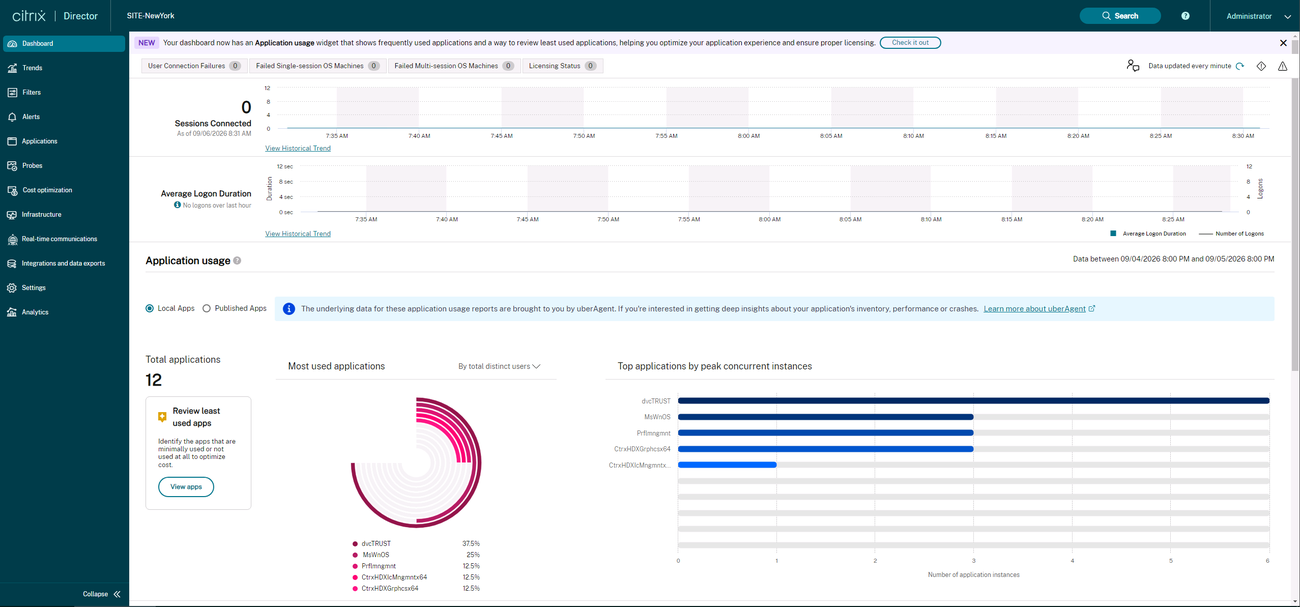
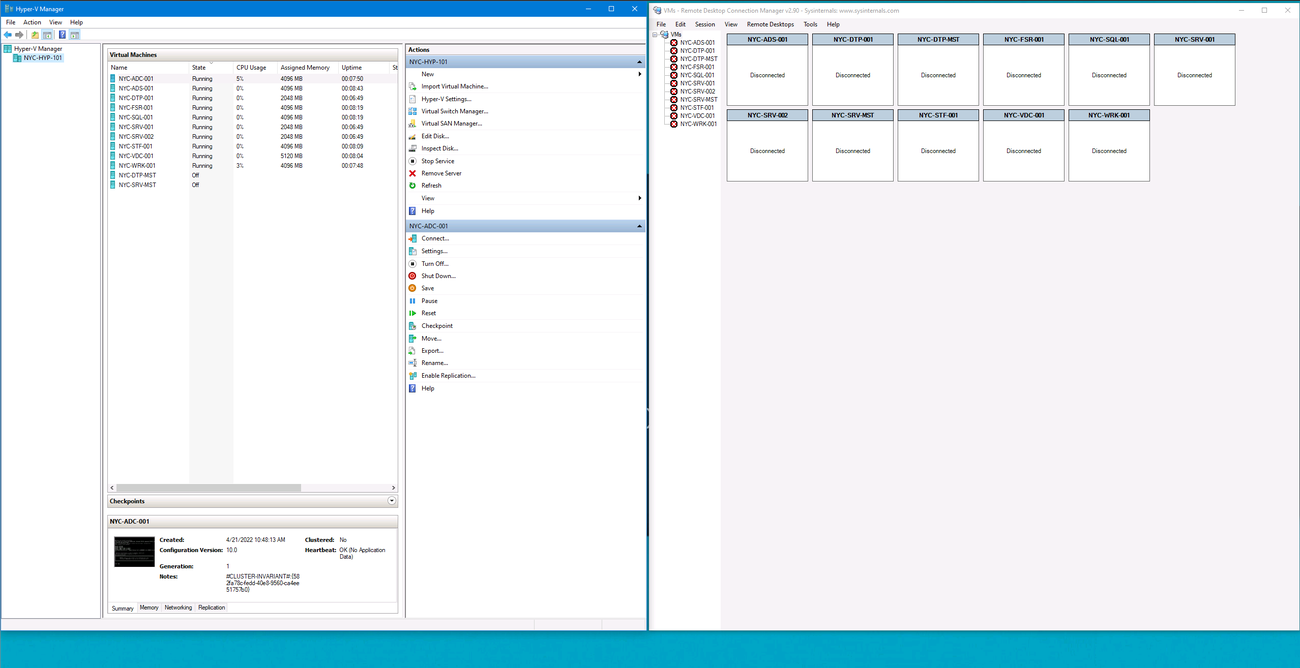
The lab is a hosted environment: ten VMs on a Hyper-V host you RDP into, Citrix Virtual Apps and Desktops 7 2507 LTSR, a StoreFront, a NetScaler, a Delivery Controller with Director installed on it, two server VDAs with 2 GB of RAM each, and a Windows 11 VDA. You get the CTX-202 lab manual (March 2026 edition) and a three-hour lab timer.
Was a guided click-through going to teach me anything the docs couldn’t? Two things, as it turned out, plus one place where the manual was wrong and the product’s own dialog box was right.
Where Director gets its numbers
Director is a website. In this lab it runs on the same server as the Delivery Controller (NYC-VDC-001), and the Start menu icon on that server is a bookmark to the URL.
It collects nothing itself. The controllers keep the live state (sessions, load, registration) in the Site database, and Director shows that as ‘real-time’ data refreshed about once a minute. The Monitor service writes history into a separate Monitoring database, and the Trends pages read that.
The consequence I hadn’t thought about: if SQL goes down, the controllers keep brokering from Local Host Cache and users mostly don’t notice, but Director goes dark.
I saw three refresh intervals in one morning: every minute on the dashboard, every 30 seconds on a session page, every 60 seconds on a machine page.
Studio first
The first exercise had me open sessions as two users, HR1 from a Windows 11 endpoint and Engineer1 from the landing VM, and then look at them in Web Studio before touching Director. Studio has the same session actions Director has (log off, disconnect, send message) and the same machine actions (power, maintenance mode).
What Studio has that Director doesn’t is everything that changes the configuration: catalogs, master images, adding machines.
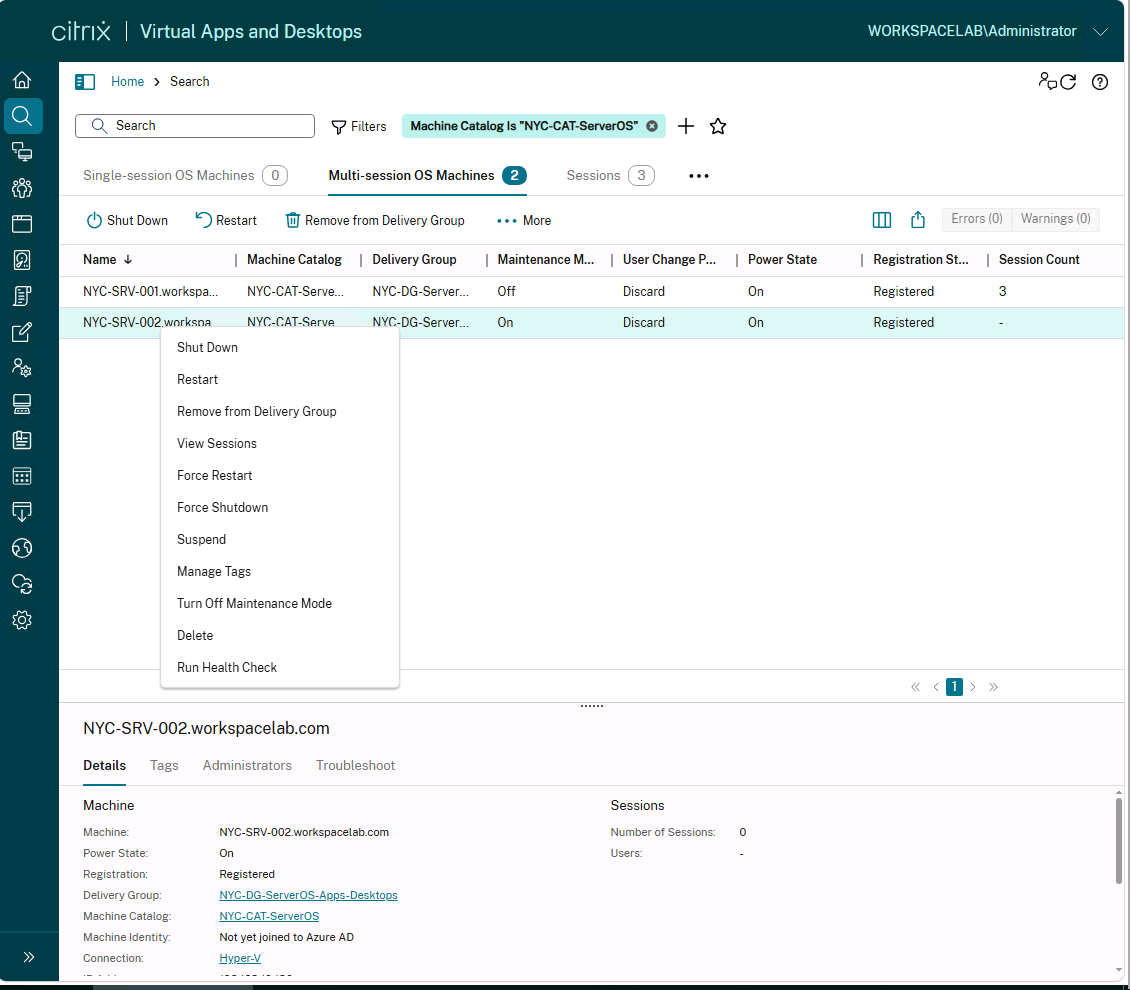
NYC-SRV-002 had been left in maintenance mode by whoever built the lab, so all three sessions landed on NYC-SRV-001. Maintenance mode is the same idea as drain mode in AVD, and I watched it work without touching it.
One of the three sessions showed as Disconnected with no brokering time. I don’t know why. I hadn’t closed anything on purpose.
One user, three screens
Every user ticket in Director starts the same way: search the user, pick the session, land on a page with three columns. Machine Details in the middle: which server, registered or not, maintenance mode, load index, VDA version 2507.0.100.428, 1 vCPU and 2048 MB.
Session Details on the right: endpoint name and IP, HDX over EDT (Citrix’s UDP transport), Workspace app version, ICA round-trip time, and the list of Citrix policies that applied to this session. The Activity Manager on the left, with the user’s applications and, on a second tab, all 33 processes in the session.
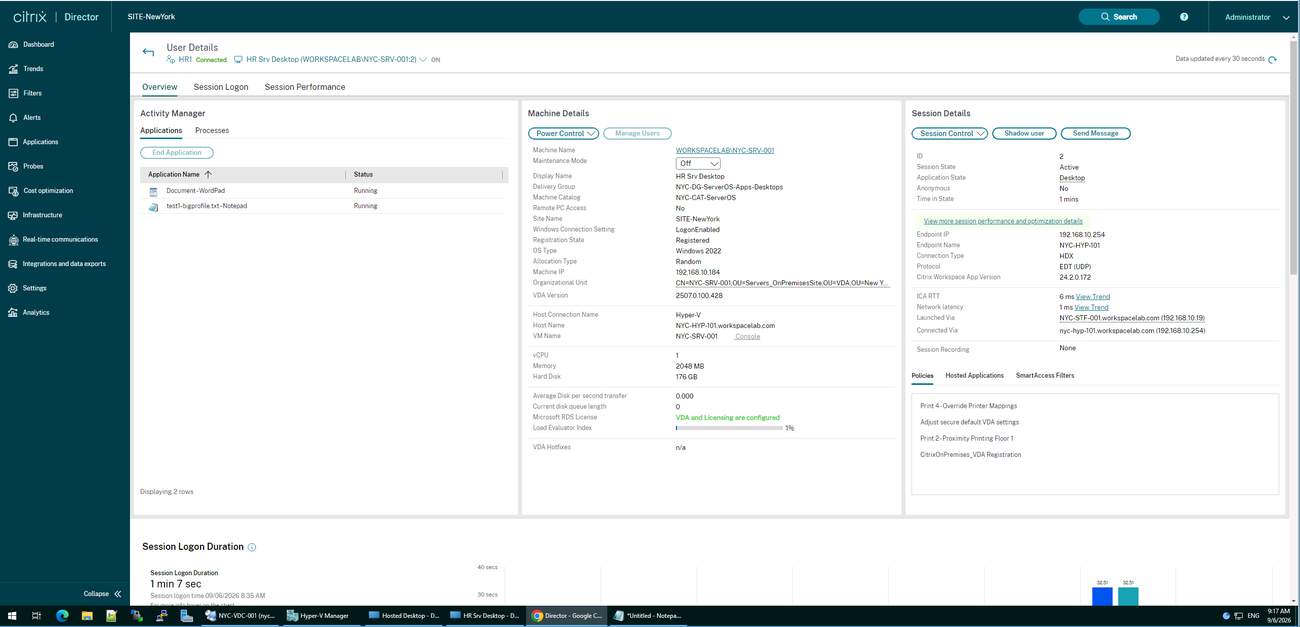
Below that is Logon Duration, and it is the reason to learn Director. HR1’s first logon at 8:35 took 1 minute 7 seconds. A second HR1 logon on the same server at 9:23, a published WordPad, took 26 seconds: 7 seconds of client and controller time and 19 seconds on the VDA, broken into brokering (0.05 s), profile load (0.96 s for a 6.06 GB roaming profile, 2 large files out of 335), logon scripts (2.31 s), and interactive session (12.79 s).
Machine start-up was skipped, with the note “Machine was already registered.”
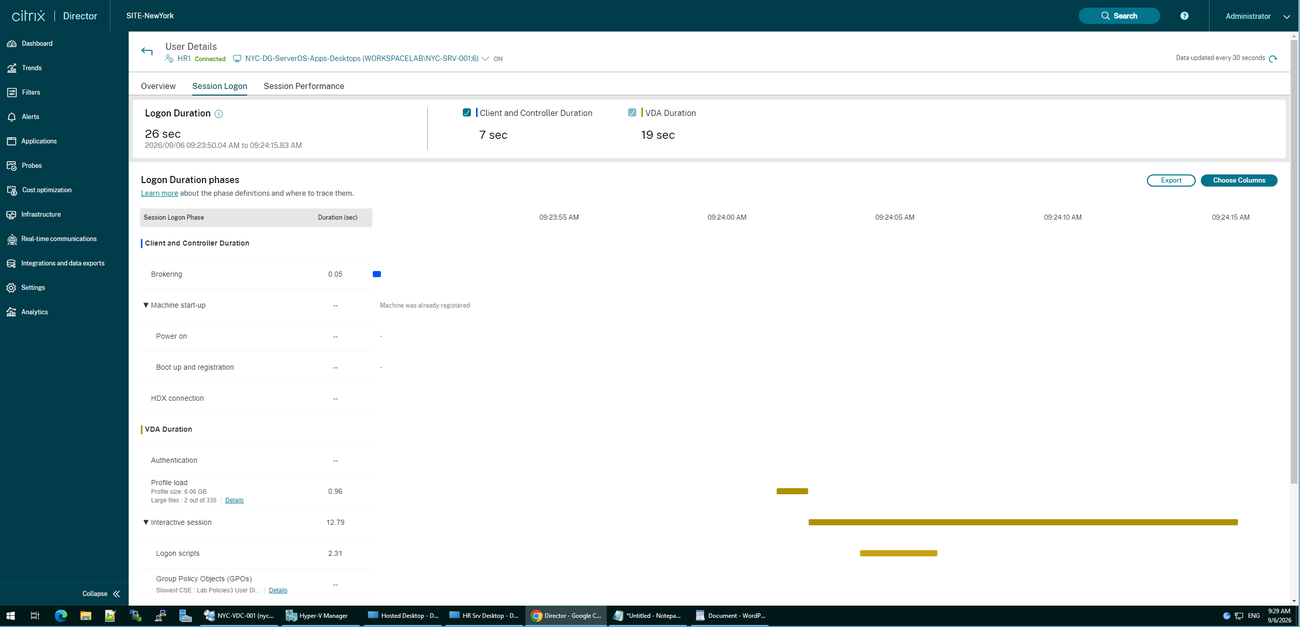
A slow logon is one of those bars, and the bar tells you which team owns it. Probably the second logon was fast because the 6 GB profile had already been pulled onto that server by the first one.
The Overview tab said 13 seconds for that same session and the Session Logon tab said 26. I still don’t know why they disagree.
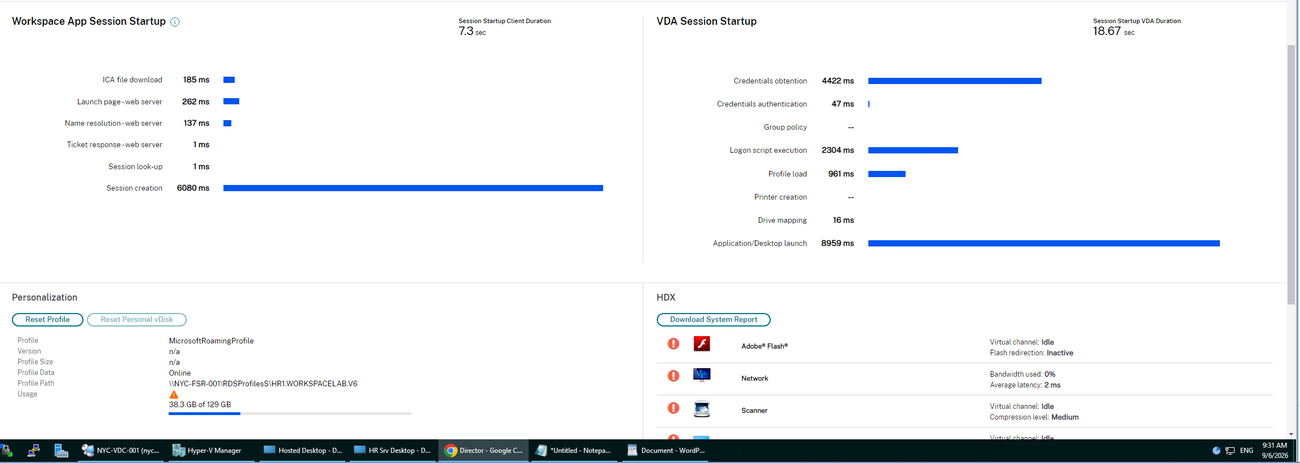
There’s a finer report under it, Workspace App Session Startup, with the client side split into pieces I’d never seen named: ICA file download 185 ms, session creation 6,080 ms, and on the VDA side, application launch 8,959 ms. Citrix documents the abbreviations here. I wrote the numbers down and moved on.
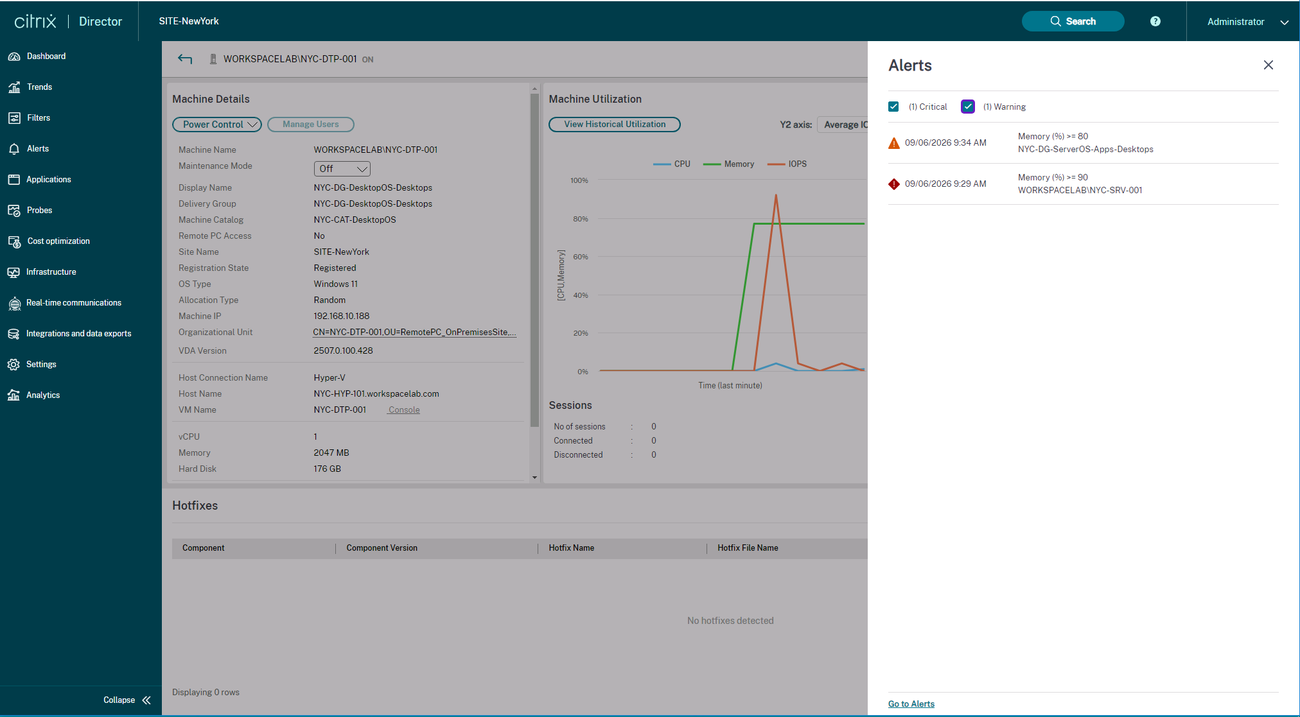
Then the part I nearly walked past. NYC-SRV-001 has 2 GB of RAM and was carrying four sessions plus my shadowing. Its Machine Details chart showed memory pinned at 100%, and the Alerts panel fired a critical alert at 9:29 for memory at or above 90% on that server.
I first read the alert as NYC-DTP-001’s, because that was the page I happened to have open. It wasn’t.
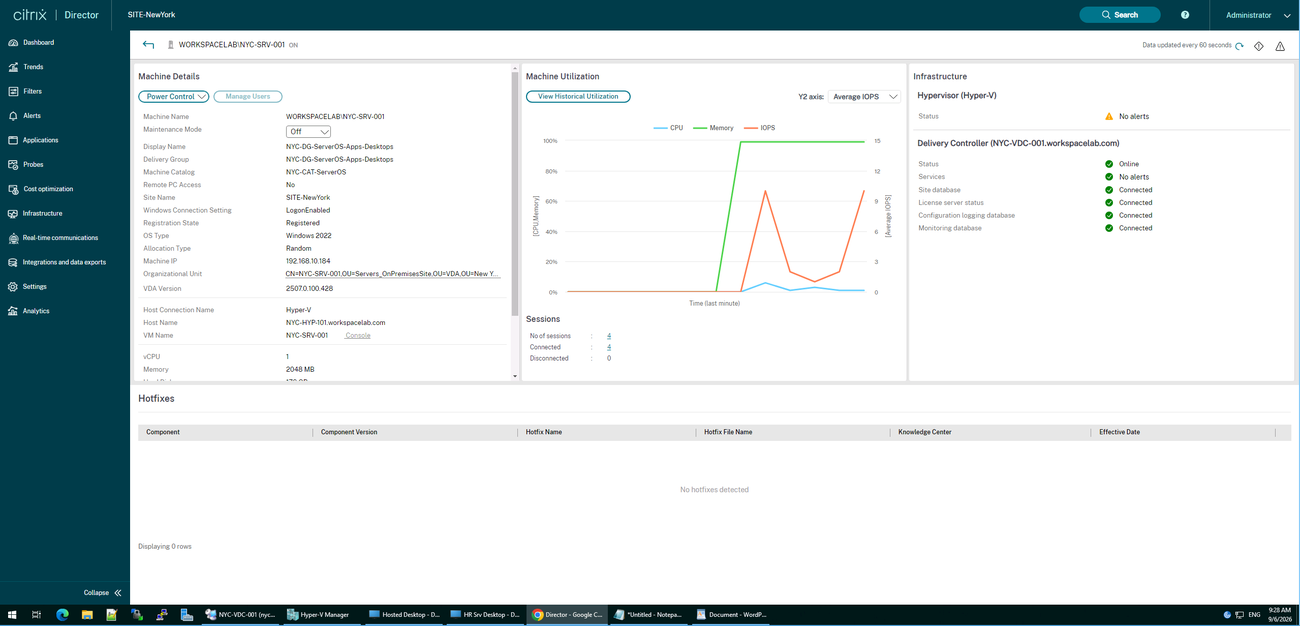
On the very same pages, the Load Evaluator Index for SRV-001 read 1%, then 2%.
Why? The load index only counts what the load management policy tells it to, and the default is session count out of 250. To the Broker, a server with no free memory was 2% loaded, and it would have kept sending users there. A monitoring number and a brokering number, disagreeing on one screen.
Same session, different endpoints
Exercise 12-3 was supposed to be about ending a process. What I noticed instead was the session ID.
HR1’s desktop session was ID 2, started at 8:35 from NYC-WRK-001. At 9:17, Director showed session 2 connected from the landing VM on Workspace app 24.2.0.172. At 9:53 it showed session 2 connected from NYC-WRK-001 again, on Workspace app 25.3.10.69 (the two lab endpoints run different versions).
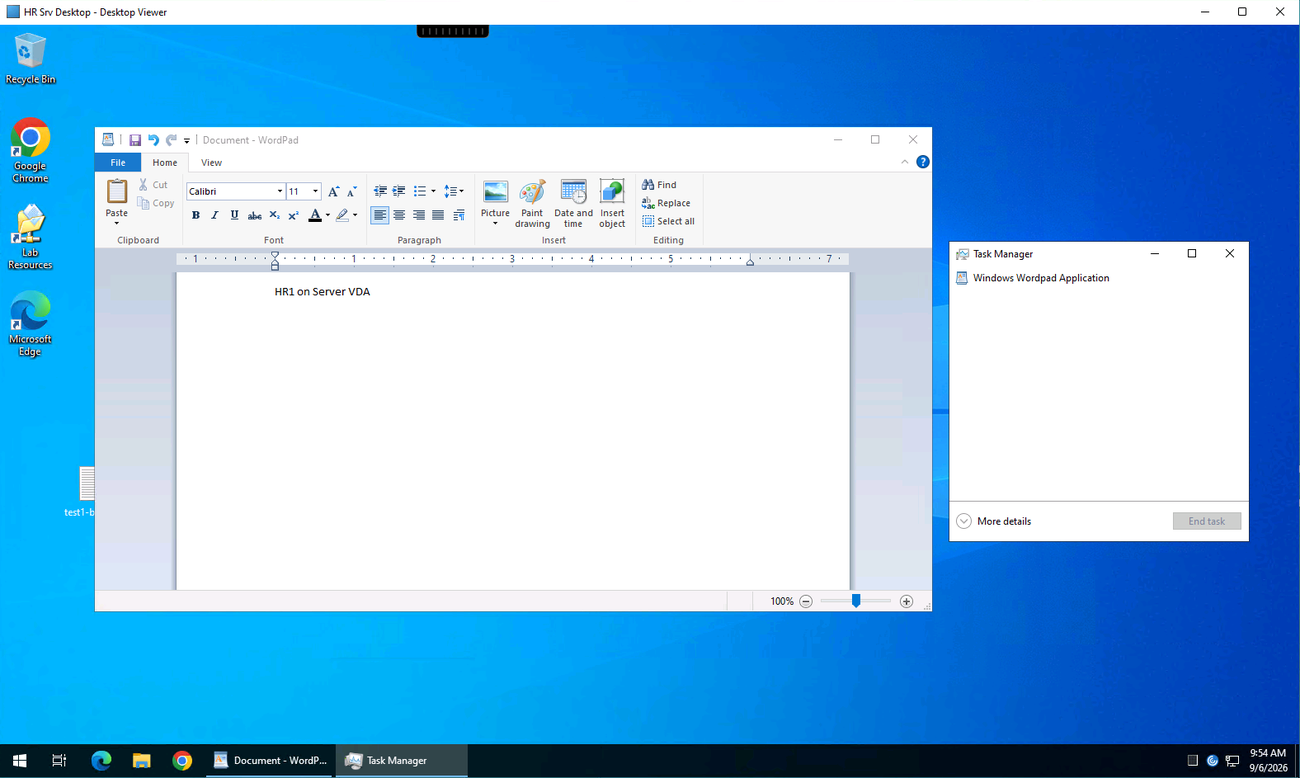
Same session, same 8:35 logon time, and the WordPad window still holding the text I had typed at 8:41. That was the disconnected session from the first exercise, reconnected by Workspace Control each time HR1 signed in somewhere new. Later in the morning the Trends page listed it as one session: 8:35 to 10:12, 1 hour 37 minutes.
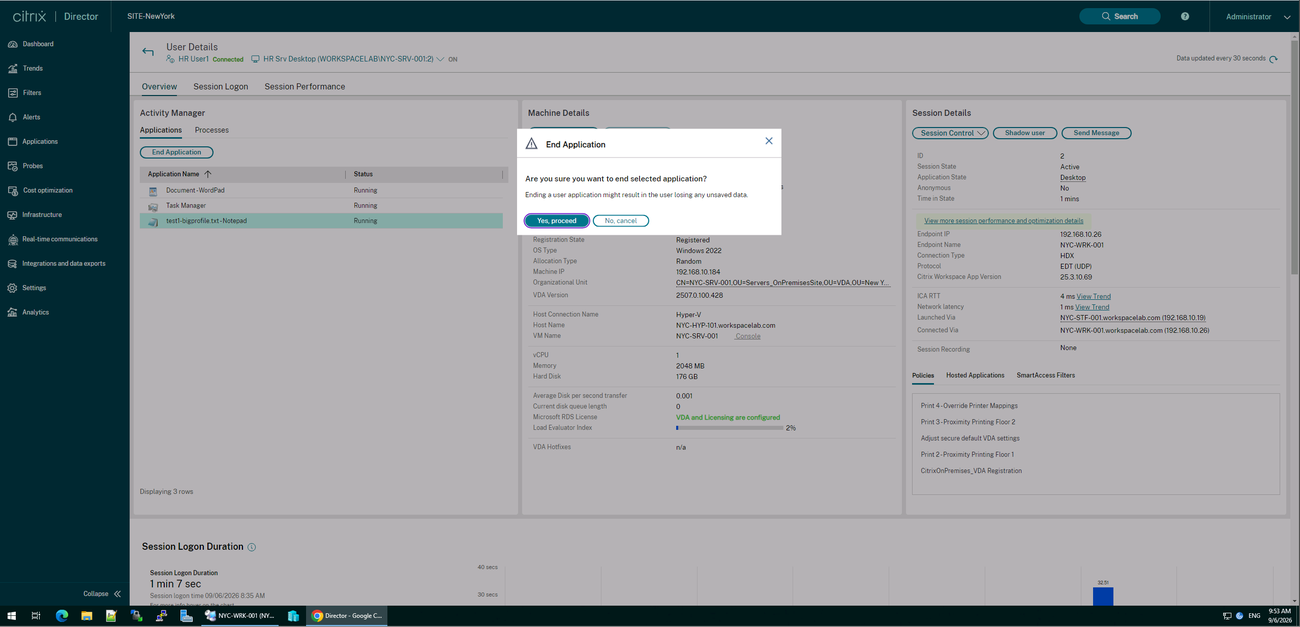
The policy list on that page changed with the endpoint too. From the landing VM the session had four policies applied; from NYC-WRK-001 it had five, the extra one a proximity printing policy for a different floor. Printing policies filter on the client’s name or address, so most likely the set was re-evaluated at reconnect.
The actual exercise: End Application on Notepad from Director, with a warning about unsaved data. Notepad closed on the user’s screen, Task Manager in the session went from two entries to one, and WordPad kept its text.
Messages, disconnects, log offs
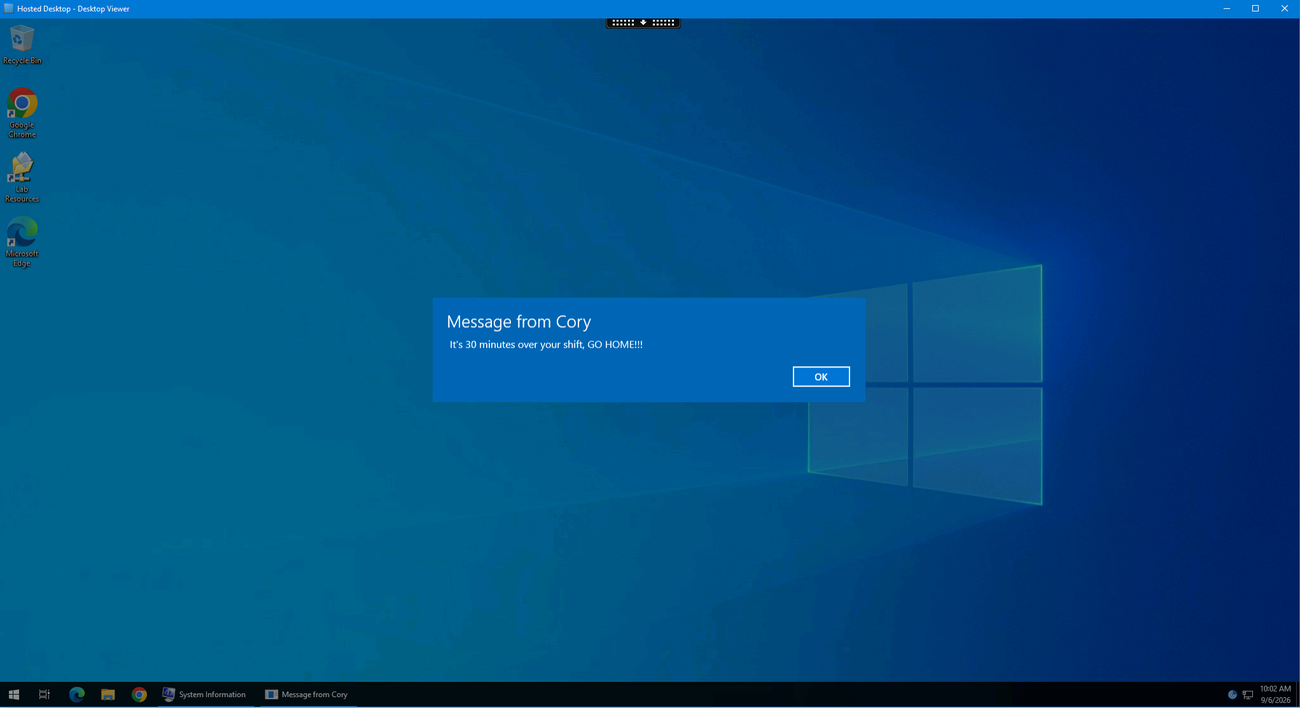
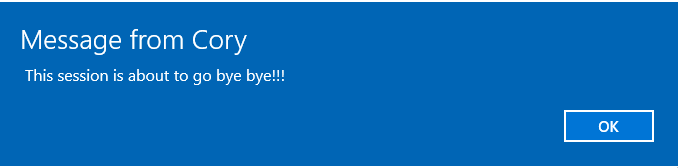
Director’s Send Message is a modal dialog in the user’s session, a subject plus up to 1,000 characters. I sent Engineer1 two:
It’s 30 minutes over your shift, GO HOME!!!
This session is about to go bye bye!!!
The first landed inside the Hosted Desktop as a dialog on the remote desktop. The second, aimed at the published Notepad, appeared as a bare dialog on my own screen, because a published app has no desktop to draw it in.
Then I disconnected the Notepad session from Director. Session State went to Disconnected, Application State stayed Active, Protocol went to n/a, ICA RTT to ‘…’, and the Shadow user button greyed out.
A minute earlier, on the same page, ICA RTT and network latency had shown ‘Error fetching data’ in red. No idea why. It went away.
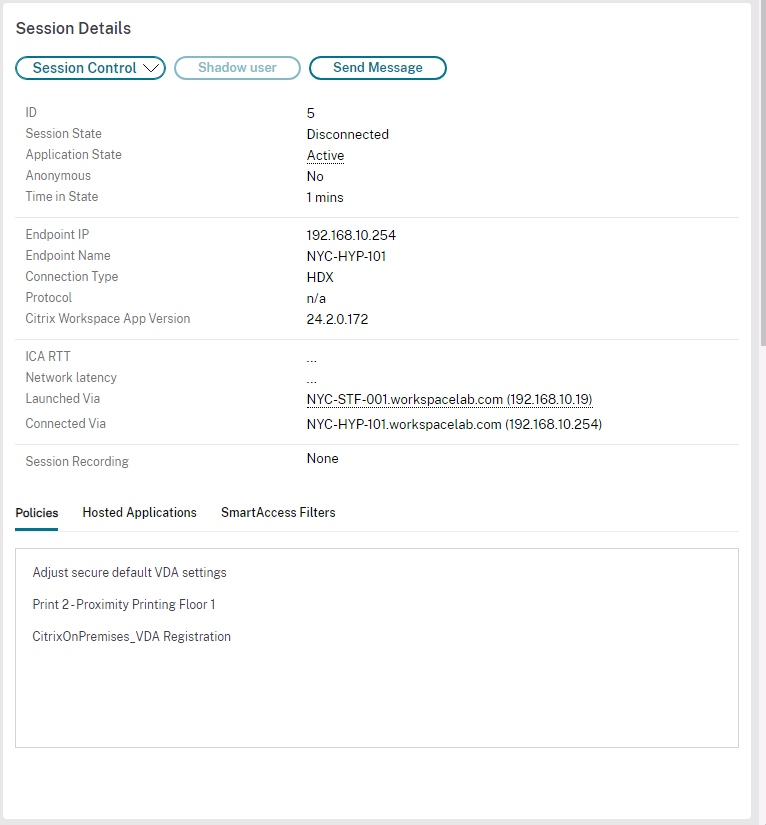
The manual’s point is that a disconnected session is still running on the server, still holding its memory and its place in the load index. When Engineer1 reconnected, the Notepad still read “Engineer1 on Server VDA”. Whether I had retyped that line a few minutes earlier in a fresh Notepad, I can’t tell you; Trends later showed Engineer1’s published-app session ending at 10:05 and a new one starting at 10:06.
Log off is the other half. From the Filters page I checked three sessions and logged them off in one action; Director showed a progress dialog, then 3 succeeded, 0 failed.
The confirmation text is worth reading: “Any active sessions will be impacted when the application instance logs off.” Published apps for one user on one server share a session, so logging off ’the WordPad instance’ takes Notepad with it.
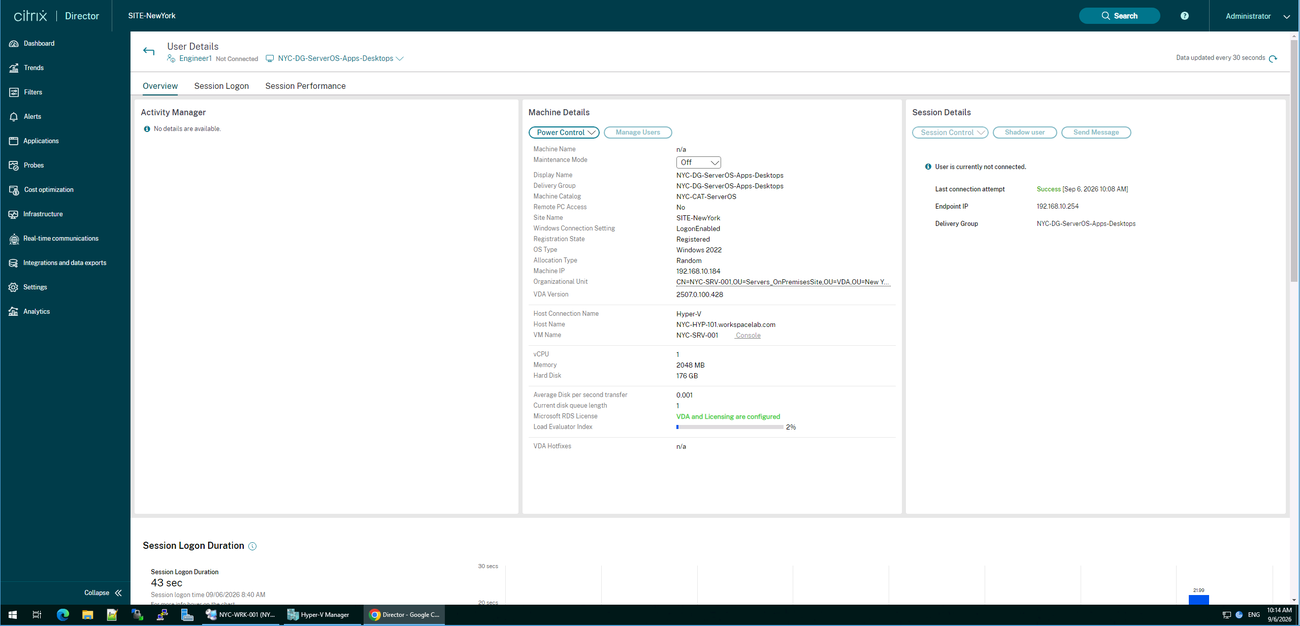
After the last log off, Engineer1’s page in Director read Not Connected, with the last connection attempt (Success, 10:08 a.m.), the endpoint IP, and the delivery group still shown.
The profile reset, and the step the manual got wrong
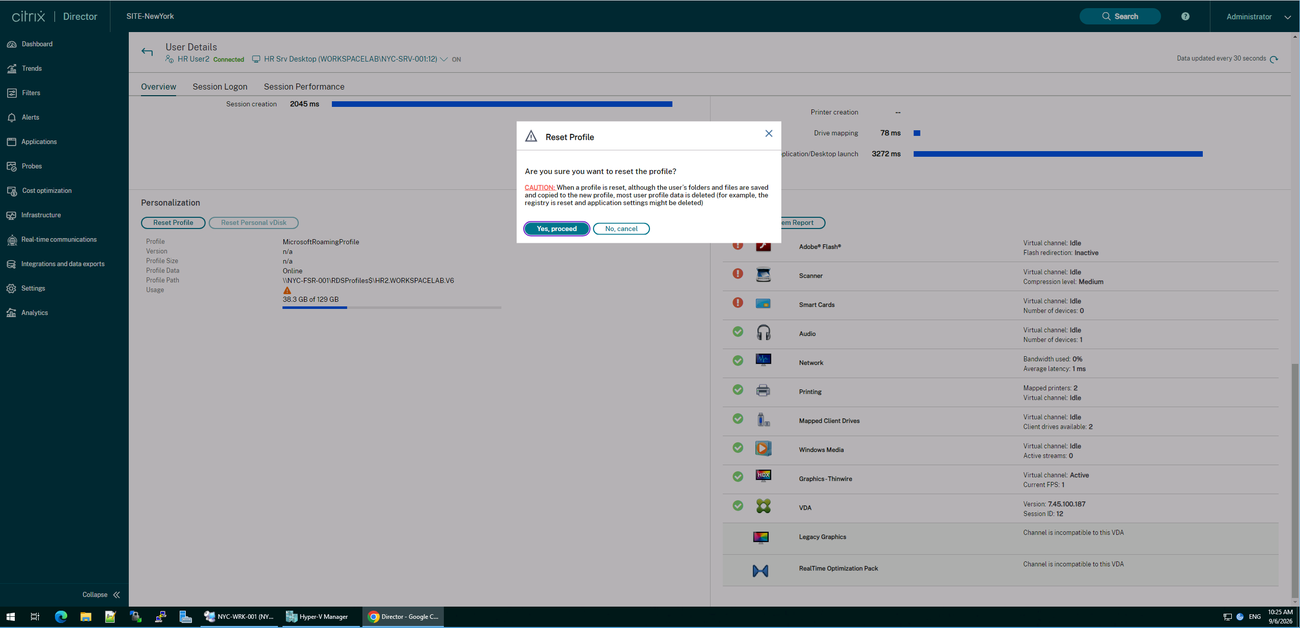
HR2 gets a Microsoft roaming profile from \NYC-FSR-001\RDSProfiles$. I created a text file on HR2’s desktop, copied a folder called misc onto it, signed out and back in to confirm both roamed, then clicked Reset Profile in Director.
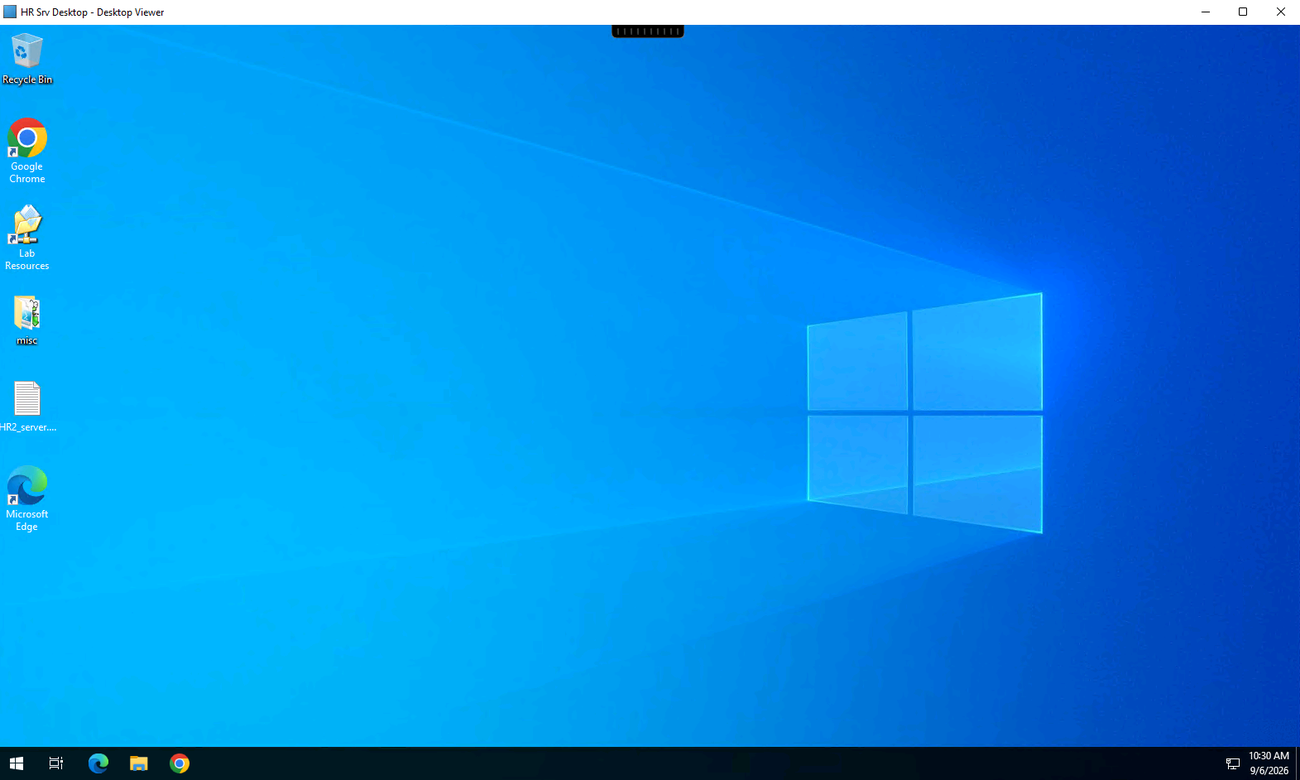
The manual says to sign out, sign back in, and verify the text file and the folder are gone.
They weren’t. I did it twice.
The dialog I had clicked through both times explains it: “although the user’s folders and files are saved and copied to the new profile, most user profile data is deleted (for example, the registry is reset and application settings might be deleted)”. Desktop is a user folder. The reset keeps user folders, copies them into the new profile, and throws away the registry hive and application settings.
The manual’s own key takeaway two paragraphs later says the same thing; only its verification step is wrong.
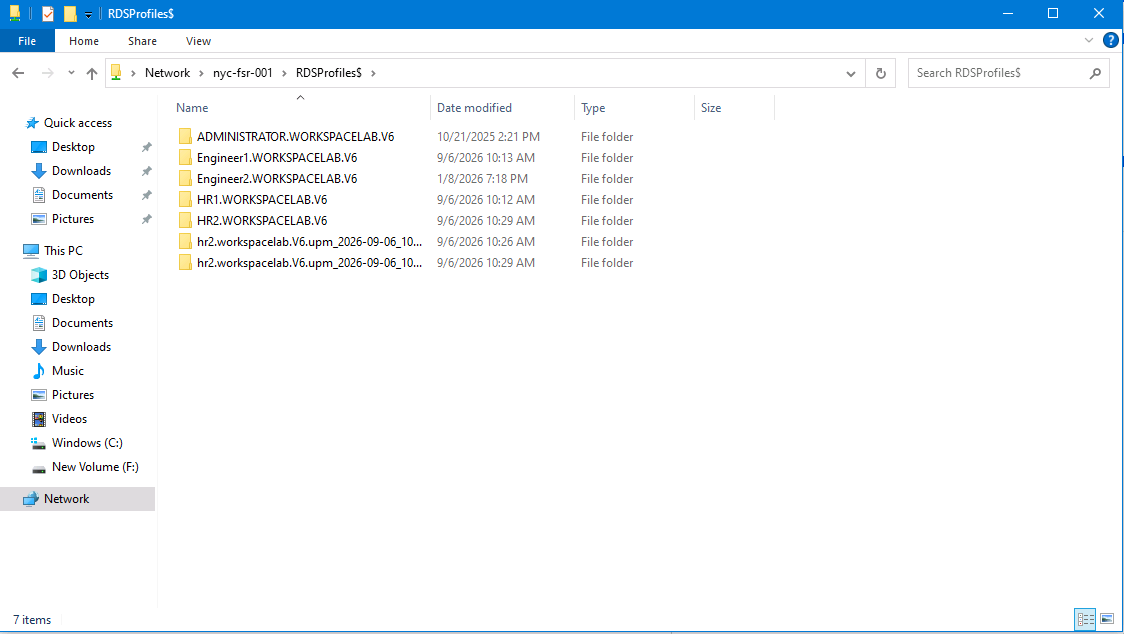
The share proved the resets ran. HR2.WORKSPACELAB.V6 was modified at 10:29, and next to it sat two backup folders, hr2.workspacelab.V6.upm_2026-09-06_10… modified at 10:26 and 10:29, one per reset.
In the same listing, HR1’s profile folder was modified at 10:12 and Engineer1’s at 10:13, which is the minute I bulk logged them off. Roaming profiles write back at log off, and the timestamps matched to the minute.
One more thing on that page: the Personalization panel’s “38.3 GB of 129 GB” is the profile share’s usage, not the user’s profile (Profile Size read n/a). The manual reads it as the profile being 30-45 GB.
HDX, and Flash
The HDX panel on a session page lists every virtual channel, the named sub-streams inside the one ICA connection, with a red, orange, or green marker. For HR1’s desktop: Flash, Scanner, and Smart Cards red because nothing was attached; Audio, Network, Printing (2 mapped printers), Mapped Client Drives (2), Windows Media, and Graphics green. Thinwire was the only active channel: high priority, 18 bps of output bandwidth, 1 frame per second, one 1575 by 912 monitor, on a desktop where nothing was moving.
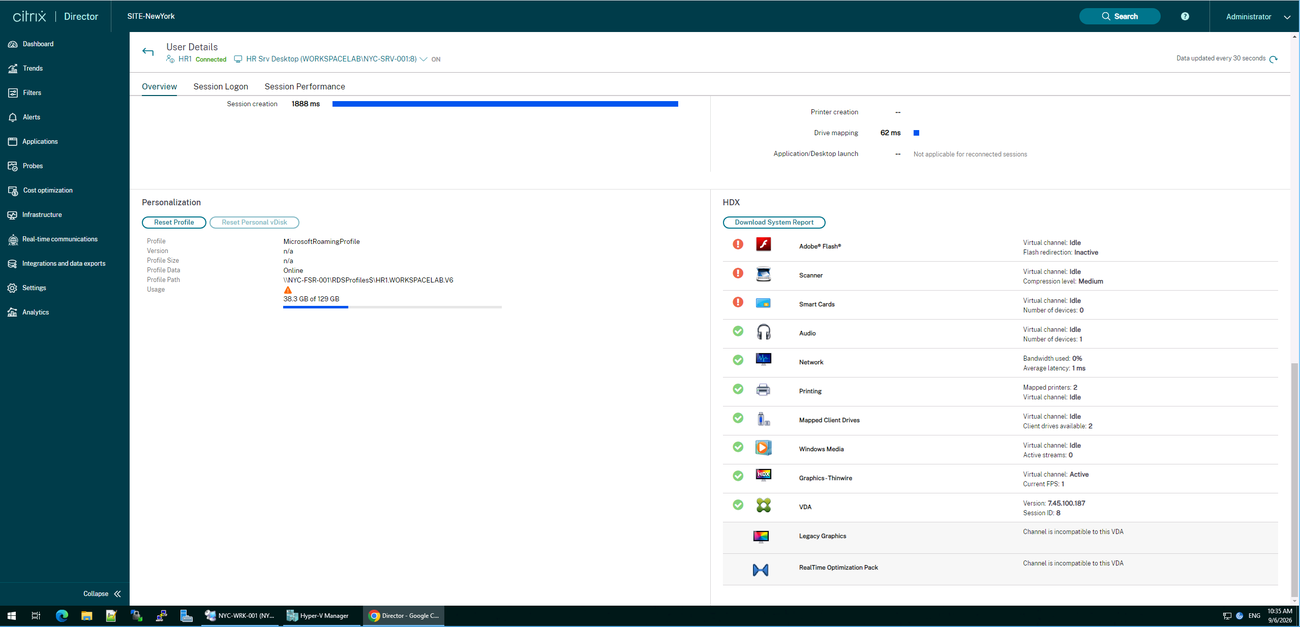
Director still checks for an Adobe Flash channel, and its advice for the red marker is to install the latest Flash Player, with “IE 9 is supported” underneath. Flash has been end of life since 2020.
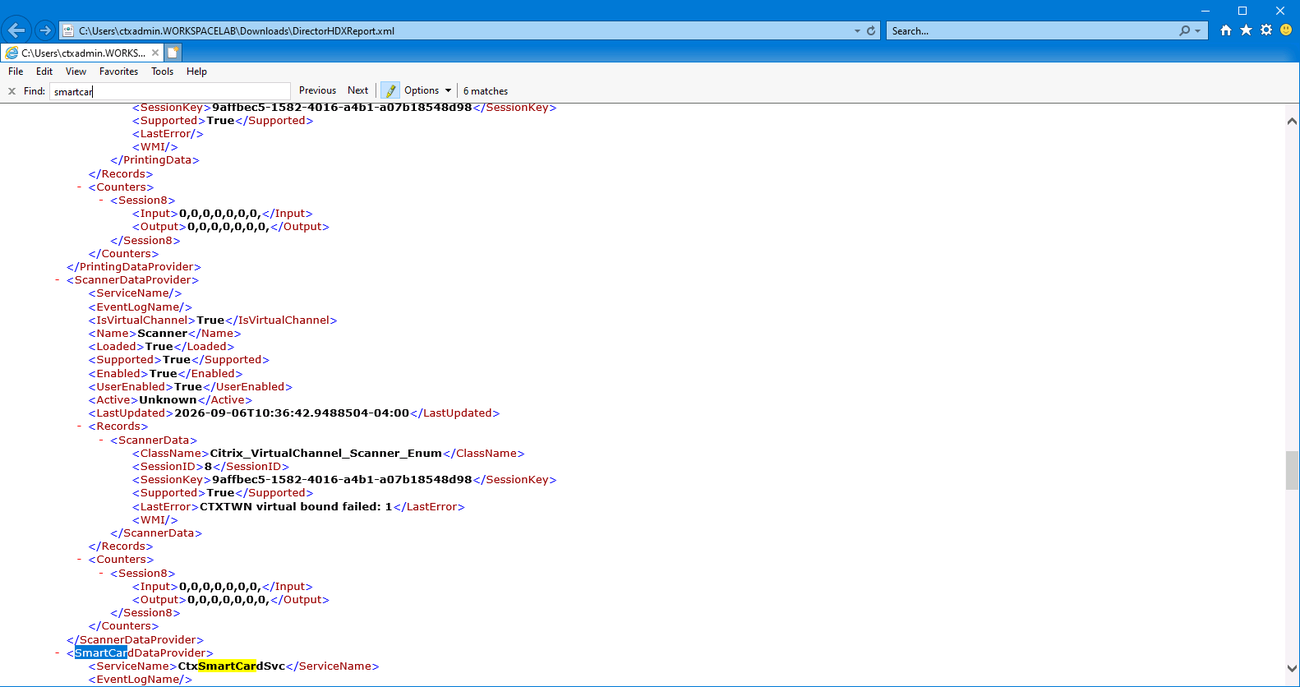
Download System Report gave me DirectorHDXReport.xml, which the landing VM opened in Internet Explorer. Each channel is a provider with Loaded, Supported, Enabled, and LastError fields. The scanner provider’s LastError was “CTXTWN virtual bound failed: 1”, CTXTWN being the TWAIN channel.
The VDA entry listed component versions: HDX IcaManagement 7.45.100.187, App Experience 7.45.100.272, Diagnostics Facility 7.2.4.112, installed under C:\Program Files (x86)\Citrix\HDX\bin. 7.45 is the number behind the 2507 label.
Shadowing is Remote Assistance
Shadow user in Director generates a Windows Remote Assistance invitation, a 356-byte .msrcincident file the browser downloads. Open it and Remote Assistance connects to the user’s session on the VDA. The user gets a prompt: “Would you like to allow HelpAssistant to connect to your computer?” Until they click Yes, the admin window is blank.
Click Request control and the user gets a second prompt, this one naming the real account (ctxadmin, the landing VM’s login, not the Administrator account I used in Director), with a checkbox to let the helper answer UAC prompts.
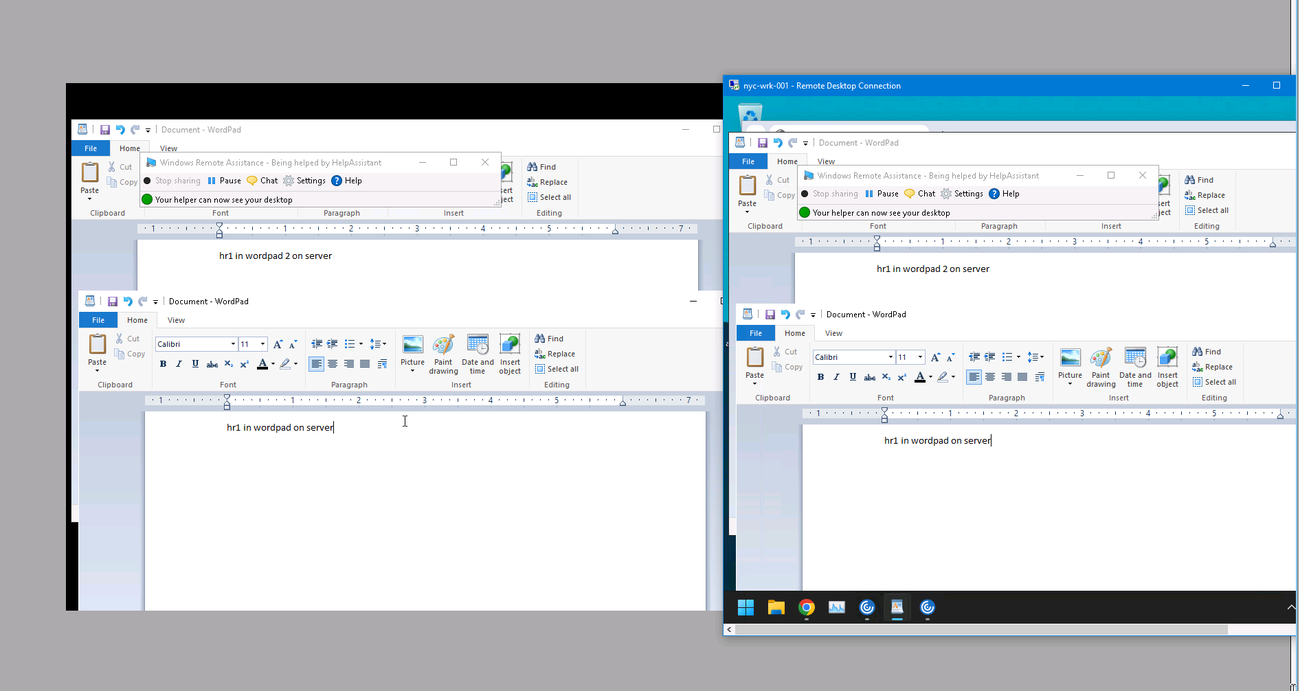
The session I shadowed was two published WordPads, both in one session (ID 17), and the shadow view had a black background with two floating WordPad windows, because a published-app session has no desktop to draw. Once I had control I typed “Admin did this” into the first WordPad and watched it appear on both sides.
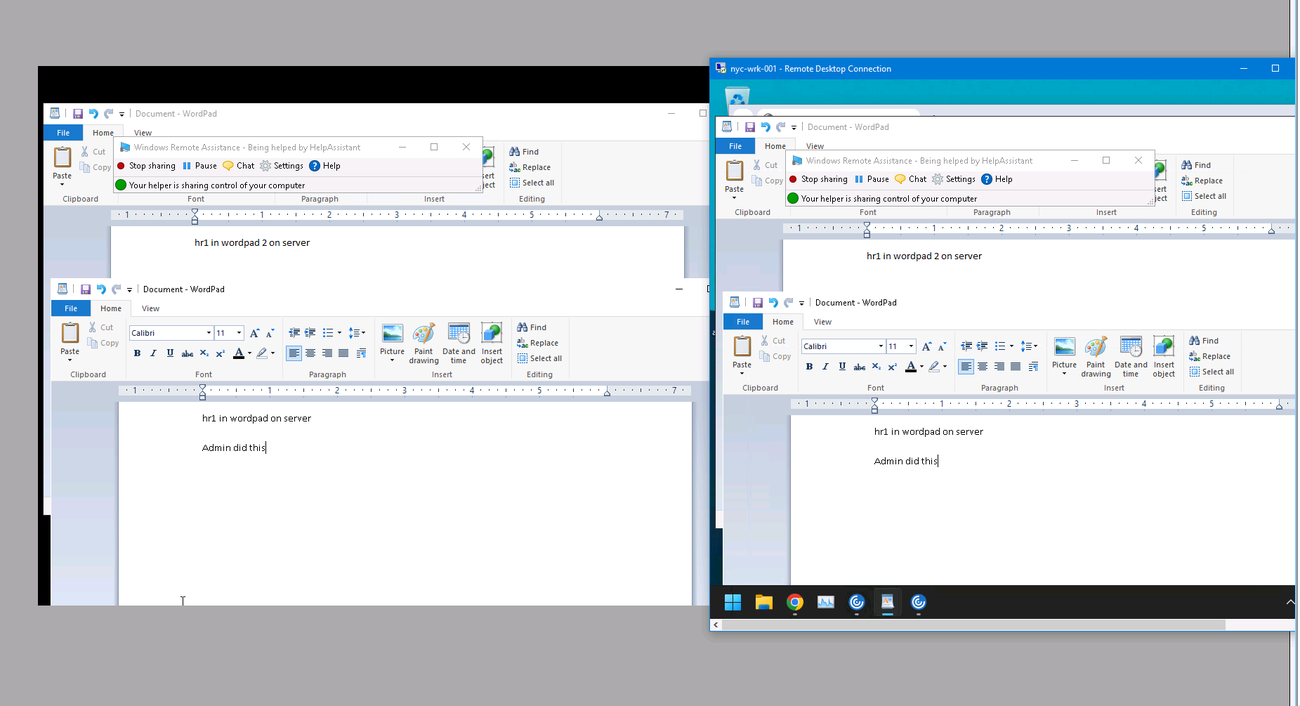
I had played with the Shadow button earlier in the morning on HR1’s full desktop, and it worked the same way. The user can stop sharing at any time.
Breaking capacity on purpose
The last exercise I have screenshots for turns the load index finding around. In Web Studio’s Policies list, a policy called SRV-Load Management sat disabled at priority 6, below the built-in Unfiltered policy at 5. I enabled it, selected both server VDAs, and clicked Restart.
They restarted one at a time: SRV-001 down and back up, then SRV-002. I hadn’t expected that.
Studio sends power actions through the hosting connection, and hosting connections throttle concurrent actions (by default a percentage of the machines on the connection), which on a three-VM connection rounds to one. Most likely that’s what I saw.
Get-BrokerMachine in PowerShell on the controller caught it
mid-flight:
first run    NYC-SRV-001  MultiSession  LoadIndex 0      Unregistered
             NYC-SRV-002  MultiSession  LoadIndex 0      Registered
second run   NYC-SRV-001  MultiSession  LoadIndex 10000  Initializing
             NYC-SRV-002  MultiSession  LoadIndex 0      Unregistered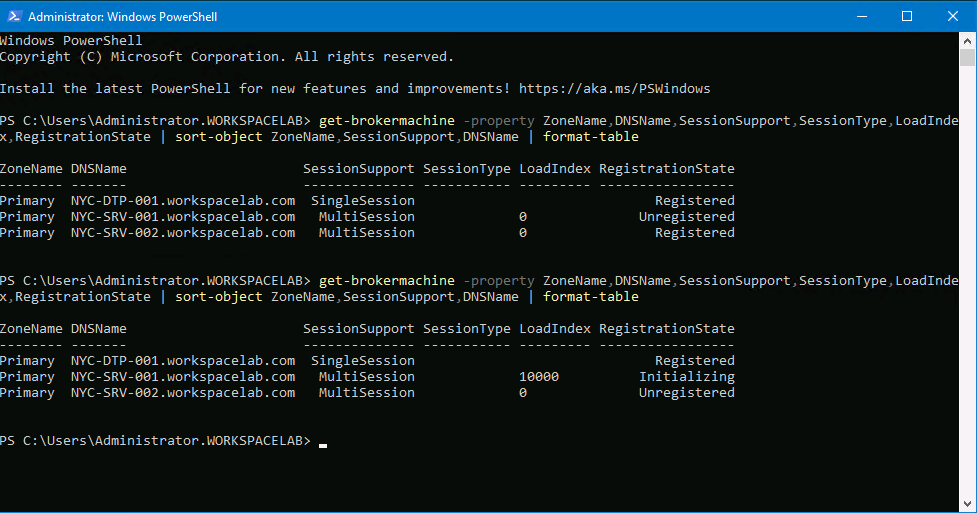
The scale is 0 to 10000. With the policy on, SRV-001 reported full before it had finished registering. With SRV-002 still in maintenance mode, HR1 got a desktop at 11:04 and nobody after that got anything.
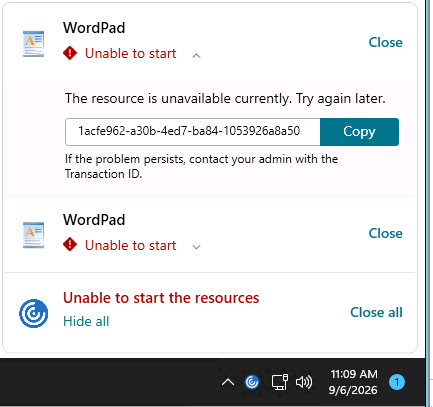
Engineer1’s two WordPad launches failed in the Workspace app with
“Unable to start” and, expanded, “The resource is unavailable
currently. Try again later.” plus a Transaction ID
(1acfe962-a30b-4ed7-ba84-1053926a8a50). HR2’s desktop failed in
StoreFront with Cannot start desktop "HR Srv Desktop".
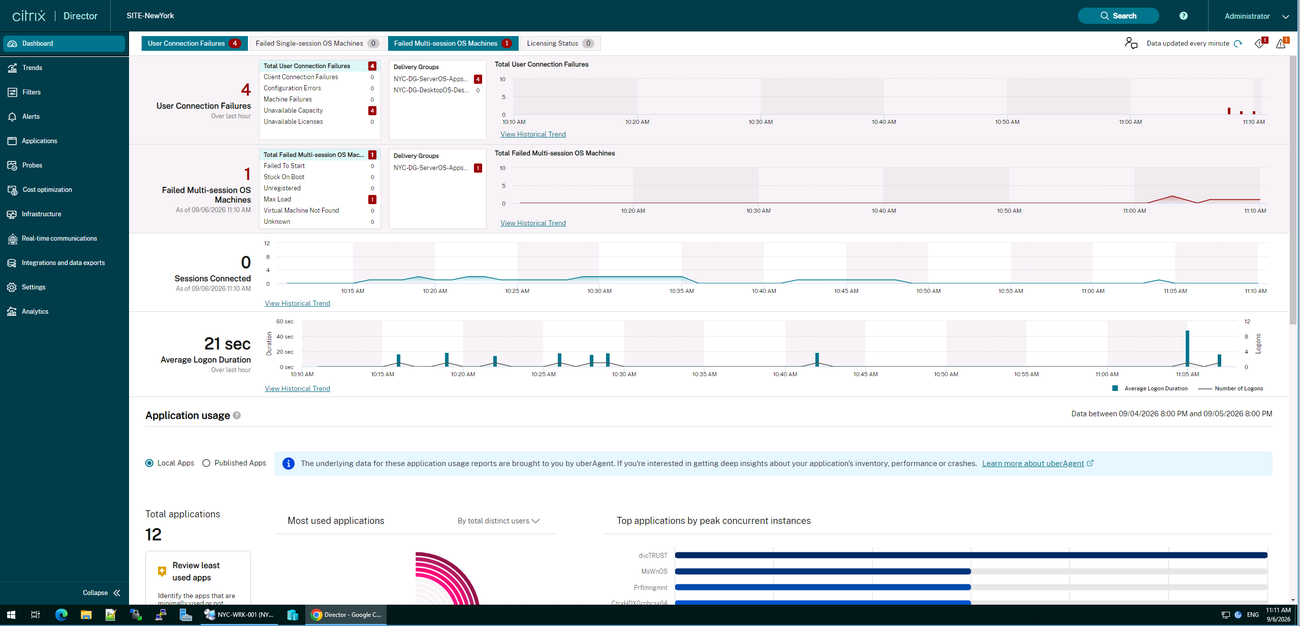
Director’s version of the same three minutes: the error bar at the top of the dashboard, collapsed all morning, opened with 4 User Connection Failures, all Unavailable Capacity, and 1 Failed Multi-session OS Machine, reason Max Load.
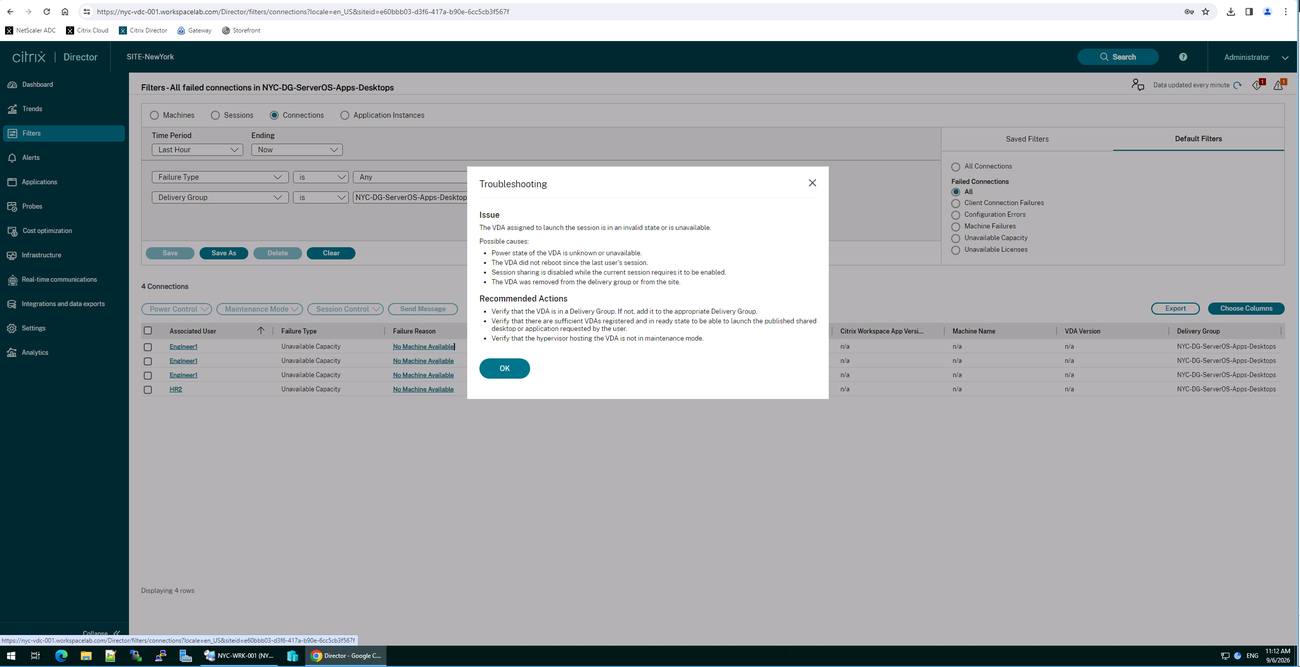
Clicking the 4 opened a Connections filter for the last hour: four rows, three Engineer1 and one HR2, failure reason ‘No Machine Available’ as a link. The link opens a card that says the VDA assigned to the launch is in an invalid state or unavailable, lists four possible causes, and gives three things to check: is the VDA in a delivery group, are enough VDAs registered and ready, is the hypervisor in maintenance mode. I hadn’t opened an event log all morning and didn’t need to for this.
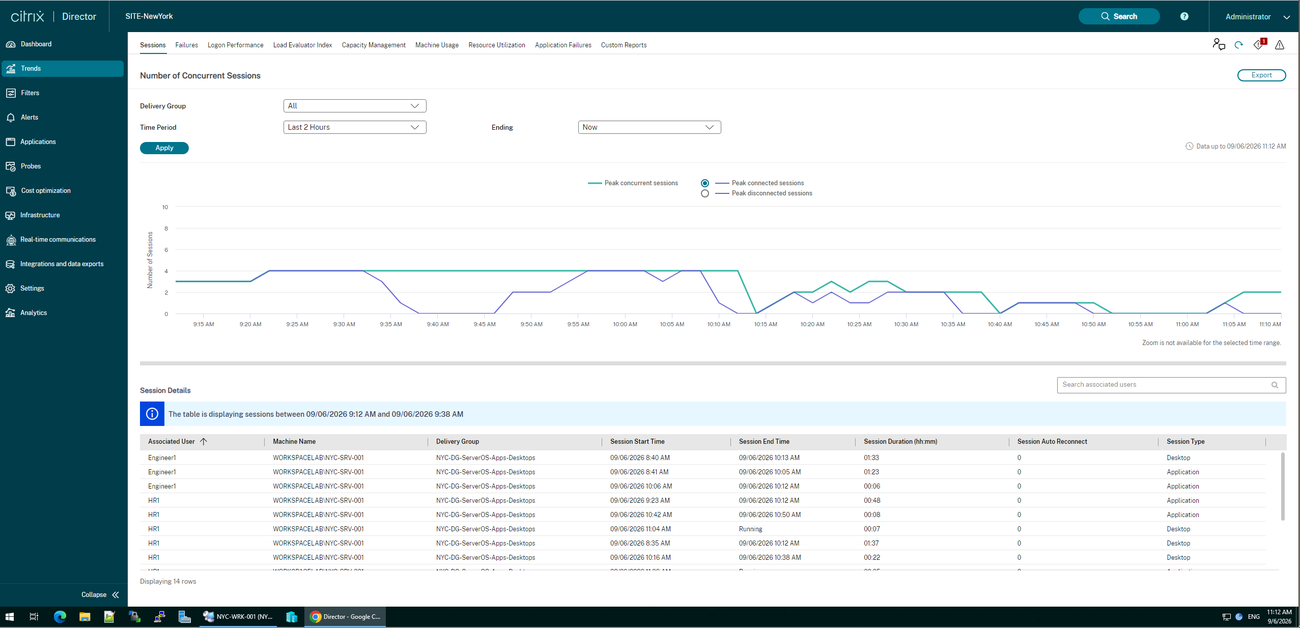
The Trends page is where the history lives, in nine tabs: Sessions, Failures, Logon Performance, Load Evaluator Index, Capacity Management, Machine Usage, Resource Utilization, Application Failures, Custom Reports. The Sessions table listed my whole morning as 14 rows with start, end, and duration; that’s where the 8:35 to 10:12 desktop session and the two Engineer1 app sessions above came from. The Failures tab showed the four failures as one spike at 11:08 to 11:10, with two ‘Events’ diamonds at about 10:55 and 11:00 that line up with the two restarts.
Built-in alerts, and one I forced
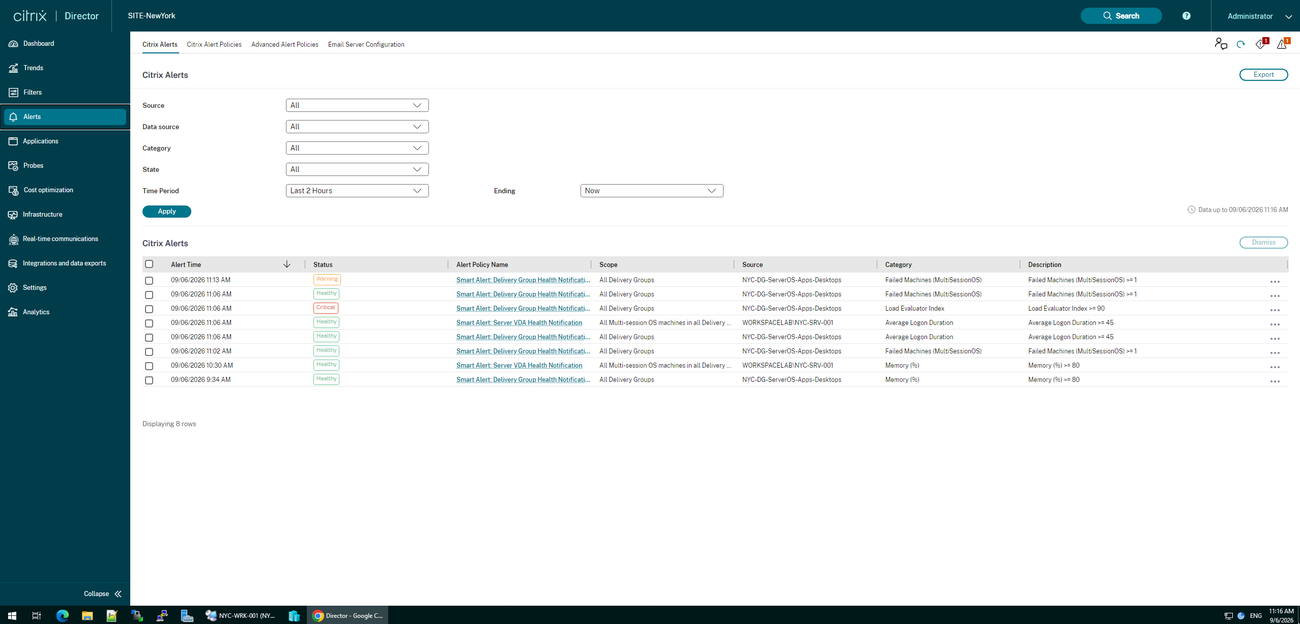
The last stop was Director’s Alerts page, and the first thing on it was a list of alerts I hadn’t set up and mostly hadn’t watched. Two policies ship enabled: Server VDA Health Notification, scoped to every multi-session machine, and Delivery Group Health Notification, scoped to the delivery groups. They had been firing on their own since 9:34.
The history was a list of things I had done. Memory (%) >= 80 on the server delivery group at 9:34 and on NYC-SRV-001 at 10:30. Load Evaluator Index >= 90, Critical, at 11:06, which is the capacity break. Failed Machines (MultiSessionOS) >= 1 at 11:02, 11:06, and 11:13, the last still a Warning. Every condition I had tripped by hand had a row here, each one resolved back to green once it cleared.
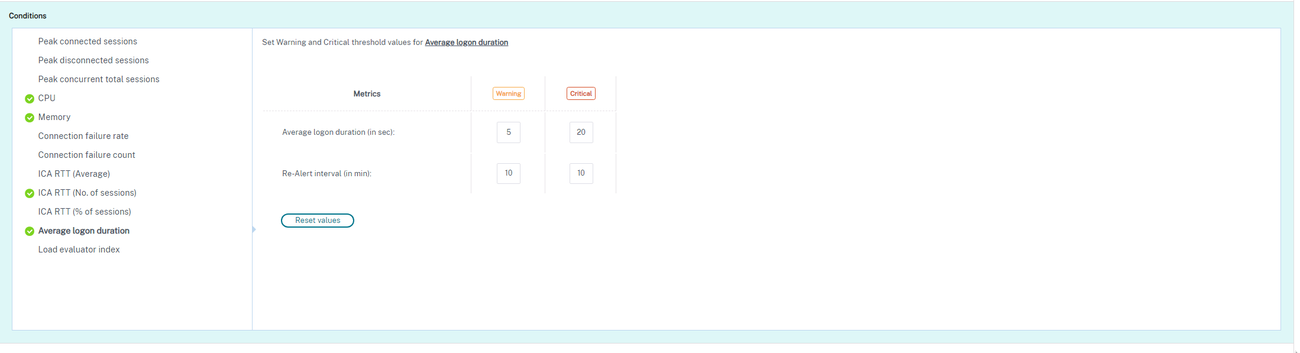
An alert policy is a set of conditions, each with a Warning and a Critical threshold and a re-alert interval. The Server VDA one had CPU, Memory, ICA RTT, and Average Logon Duration turned on out of the twelve it offers. The exercise was to make one fire on cue.
I took Average Logon Duration, default Warning at 45 seconds, and set it to 5, Critical to 20, re-alert every 10 minutes.
Then I had to produce a slow logon. The lab ships a LargeFiles.zip on a share for exactly this. I copied it to HR1’s desktop, extracted a 1 GB and a 5 GB file, and deleted the 5 GB one, leaving 1 GB of ballast in a roaming profile that already ran to 6.
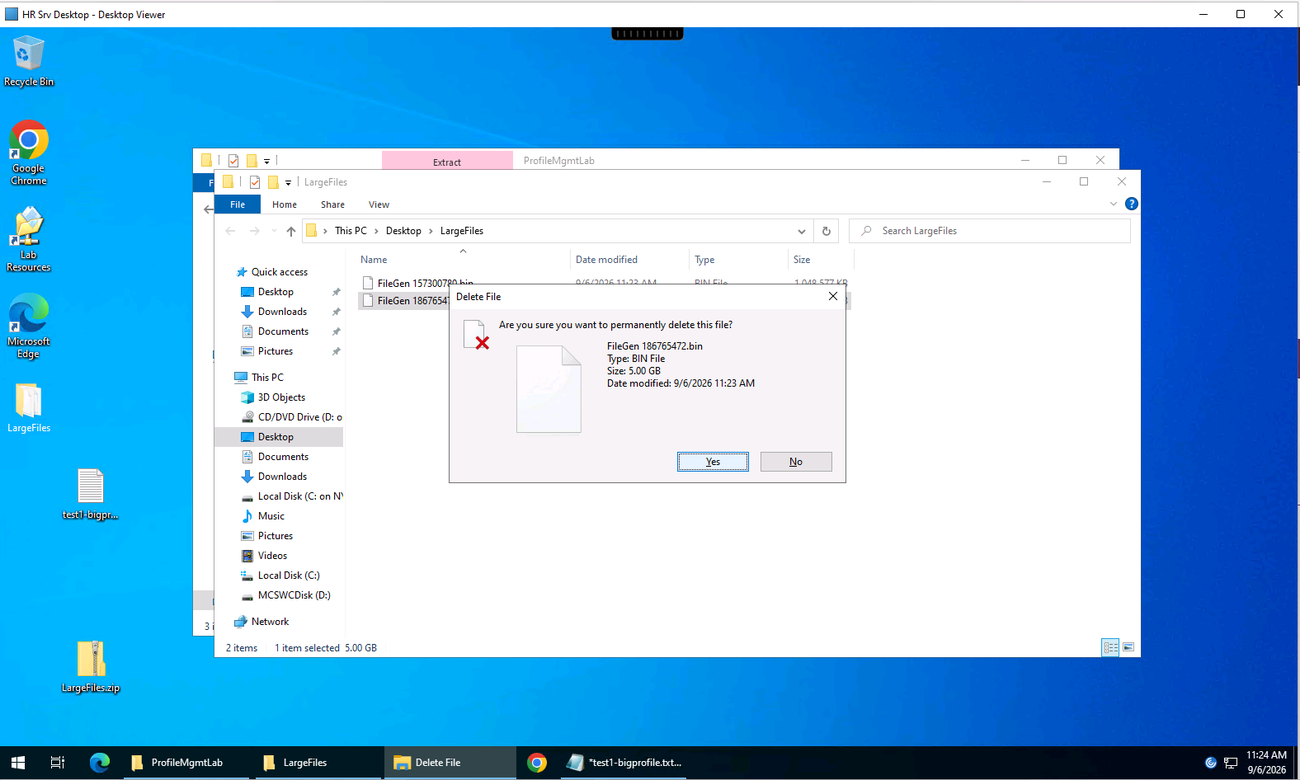
That only slows the logon if the server has to fetch the profile fresh, so I restarted NYC-SRV-001 from Studio. User Change Persistence on the catalog is Discard, so the reboot threw the cached copy away. HR1 signed back in, the profile came down the wire, the logon crossed 5 seconds, and a new Average Logon Duration warning appeared under NYC-SRV-001 a couple of minutes later. Then I put the threshold back to 45 and 60 so the next person to run the lab starts clean.
The final exercise was the reverse: build a policy instead of tripping one. I created a Custom Memory Alert, Memory Warning at 50% and Critical at 80%, scoped to all server OS machines, and then disabled it, because the minimum window before it can evaluate is 10 minutes and the lab clock had run out.
Conclusion
That was the lab, start to finish. In one morning I got hands on time with Director, Web Studio, Hyper-V Manager, Remote Desktop Connection Manager, and HDX on a real Site: sessions opened and shadowed, logons broken into phases, a profile reset, machines restarted, a capacity failure watched from both sides, and an alert policy edited until it fired. I learned a lot.
Next on the list is the HDX lab, the user-experience side of the same Site, and a closer look at the channels I only got to read about this time.